


 11 / 13

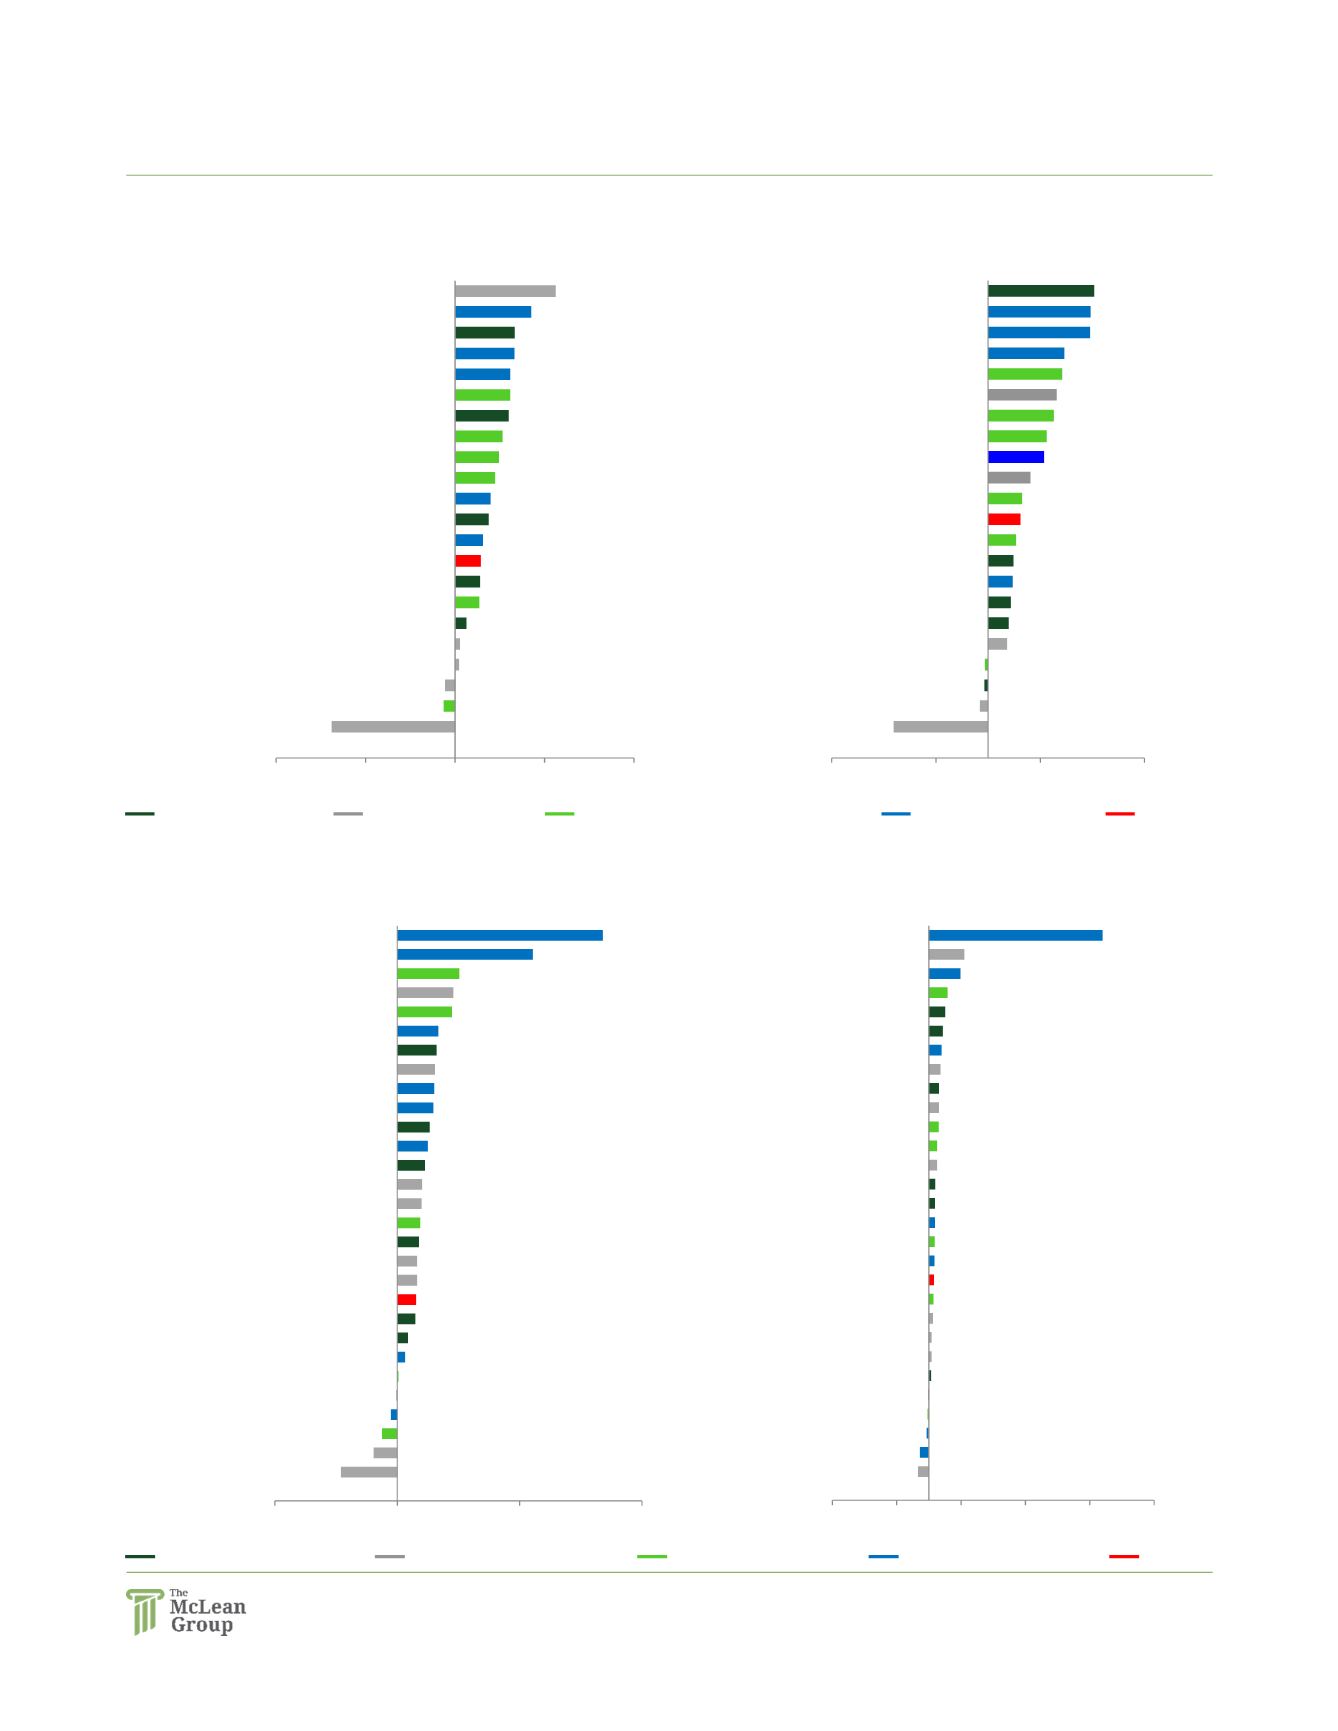
Capital Markets Overview
Defense and Government Services
11
Q3 2018 PERFORMANCE
LAST 52-WEEK PERFORMANCE
Aerospace
Q3 2018 PERFORMANCE
LAST 52-WEEK PERFORMANCE
Defense Prime Index
S&P 500
Defense Systems Index
Diversified Government Services Index
Middle Market Index
Large Cap Aerospace Index
S&P 500
Small Cap Aerospace Index
Mid Cap Aerospace Index
International Aerospace Index
(45.3%)
(4.0%)
(1.8%)
(1.5%)
9.2%
10.0%
10.9%
11.8%
12.1%
13.4%
15.6%
16.3%
20.3%
26.9%
28.2%
31.5%
32.9%
35.6%
36.6%
48.9%
49.1%
50.9%
(75%)
(25%)
25%
75%
VSE
Vectrus
General Dynamics
Engility
Kratos
Northrop Grumman
Raytheon
L-3
Lockheed Martin
Leidos
S&P 500
SAIC
KEYW
Harris
CACI
Booz
ICF
ManTech
Cubic
Teledyne
FLIR
Boeing
(33.5%)
(27.8%)
(7.1%)
(4.1%)
(1.6%)
7.3%
8.4%
8.9%
12.9%
14.2%
15.6%
17.6%
18.2%
18.8%
19.2%
20.3%
25.8%
26.0%
30.5%
31.1%
31.6%
36.1%
39.4%
43.3%
50.9%
57.9%
98.6%
110.1%
540.1%
(300%) (100%)
100% 300% 500% 700%
Leonardo
Triumph
Aerojet Rocketdyne
Esterline
Moog
Rockwell Collins
Meggitt
Rolls-Royce
Embraer
Hexcel
S&P 500
AAR
Spirit AeroSystems
Wesco Aircraft Holdings
Ametek
UTC
Thales
DigitalGlobe
Curtiss-Wright
Airbus Group
Textron
Safran
Astronics
TransDigm
Boeing
HEICO
AeroVironment
Bombardier
Intelsat
(34.5%)
(3.2%)
(2.8%)
1.1%
1.3%
3.2%
6.8%
7.0%
7.2%
7.8%
9.4%
9.9%
11.2%
12.3%
13.3%
15.0%
15.4%
15.4%
16.6%
16.7%
21.3%
28.1%
(50%)
(25%)
0%
25%
50%
VSE
SAIC
Vectrus
ICF
KEYW
Northrop Grumman
CACI
Raytheon
S&P 500
Cubic
General Dynamics
L-3
Booz
ManTech
Engility
Boeing
Leidos
Harris
FLIR
Lockheed Martin
Teledyne
Kratos
(23.0%)
(9.7%)
(6.3%)
(2.6%)
(0.4%)
0.5%
3.2%
4.4%
7.4%
7.7%
8.1%
8.1%
8.9%
9.4%
9.9%
10.2%
11.3%
12.5%
0.3%
14.7%
15.1%
15.4%
16.1%
16.8%
22.4%
23.0%
25.4%
55.4%
84.0%
(50%)
0%
50%
100%
Embraer
Bombardier
DigitalGlobe
AAR
Hexcel
Rolls-Royce
Wesco Aircraft Holdings
Rockwell Collins
TransDigm
S&P 500
Airbus Group
Meggitt
Textron
Spirit AeroSystems
Moog
Thales
Ametek
Aerojet Rocketdyne
UTC
Astronics
Curtiss-Wright
Safran
Boeing
Triumph
Esterline
Leonardo
HEICO
AeroVironment
Intelsat