


 11 / 21

12
As of 09/30/2016
12
Q3
2016
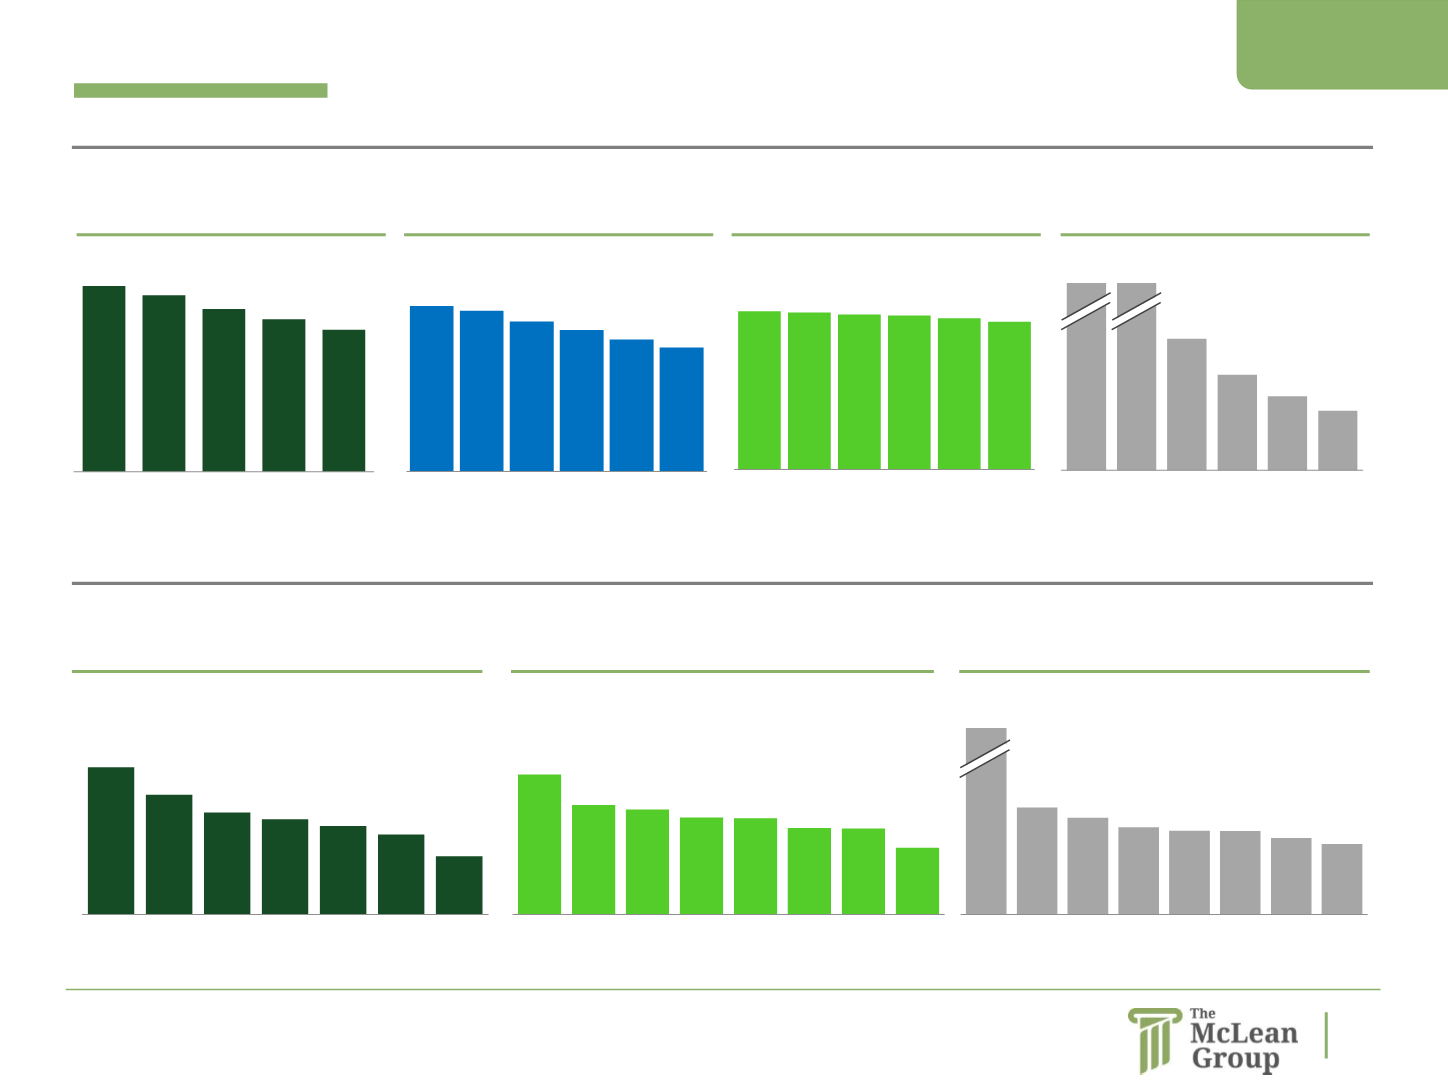
Public Market Valuations: EV/EBITDA Multiples
Defense and Government Services
Average: 11.1x
Median: 11.3x
13.3x 12.7x
11.7x
11.0x 10.2x
LMT NOC RTN BA GD
11.9x 11.8x 11.6x 11.6x 11.3x 11.1x
SAIC EGL LDOS BAH MANT CACI
12.4x 12.0x 11.2x 10.6x 9.9x 9.3x
TDY LLL FLIR CUB HRS OA
Defense Prime Index
Defense Systems Index
Diversified Gov. Services
Middle Market Index
Average: 11.8x
Average: 10.9x
Average: 11.5x
Average: 10.4x
Aerospace
Large Cap Aerospace Index
Mid Cap Aerospace Index
Small Cap Aerospace Index
Average: 15.6x
Median: 10.2x
Average: 10.6x
Average: 10.6x
Average: 9.3x
(excluding AVAV)
15.8x 12.8x 11.0x 10.2x
9.5x
8.6x
6.3x
TDG AME BA COL UTX TXT SPR
15.0x 11.7x 11.3x 10.4x 10.3x 9.3x 9.2x
7.2x
HEI BEAV CW HXL ESL OA MOG.A TGI
135.5x 11.5x 10.4x 9.4x 9.0x 9.0x 8.2x 7.6x
AVAV ATRO WAIR I
OA AIR LMIA DGI
Source: Public Filings, S&P Capital IQ
20.1x 15.1x 9.9x 7.2x 5.6x 4.5x
KTOS KEYW ICFI VSEC NCIT VEC