


 5 / 20

5
As of 08/09/2016
5
Q2
2016
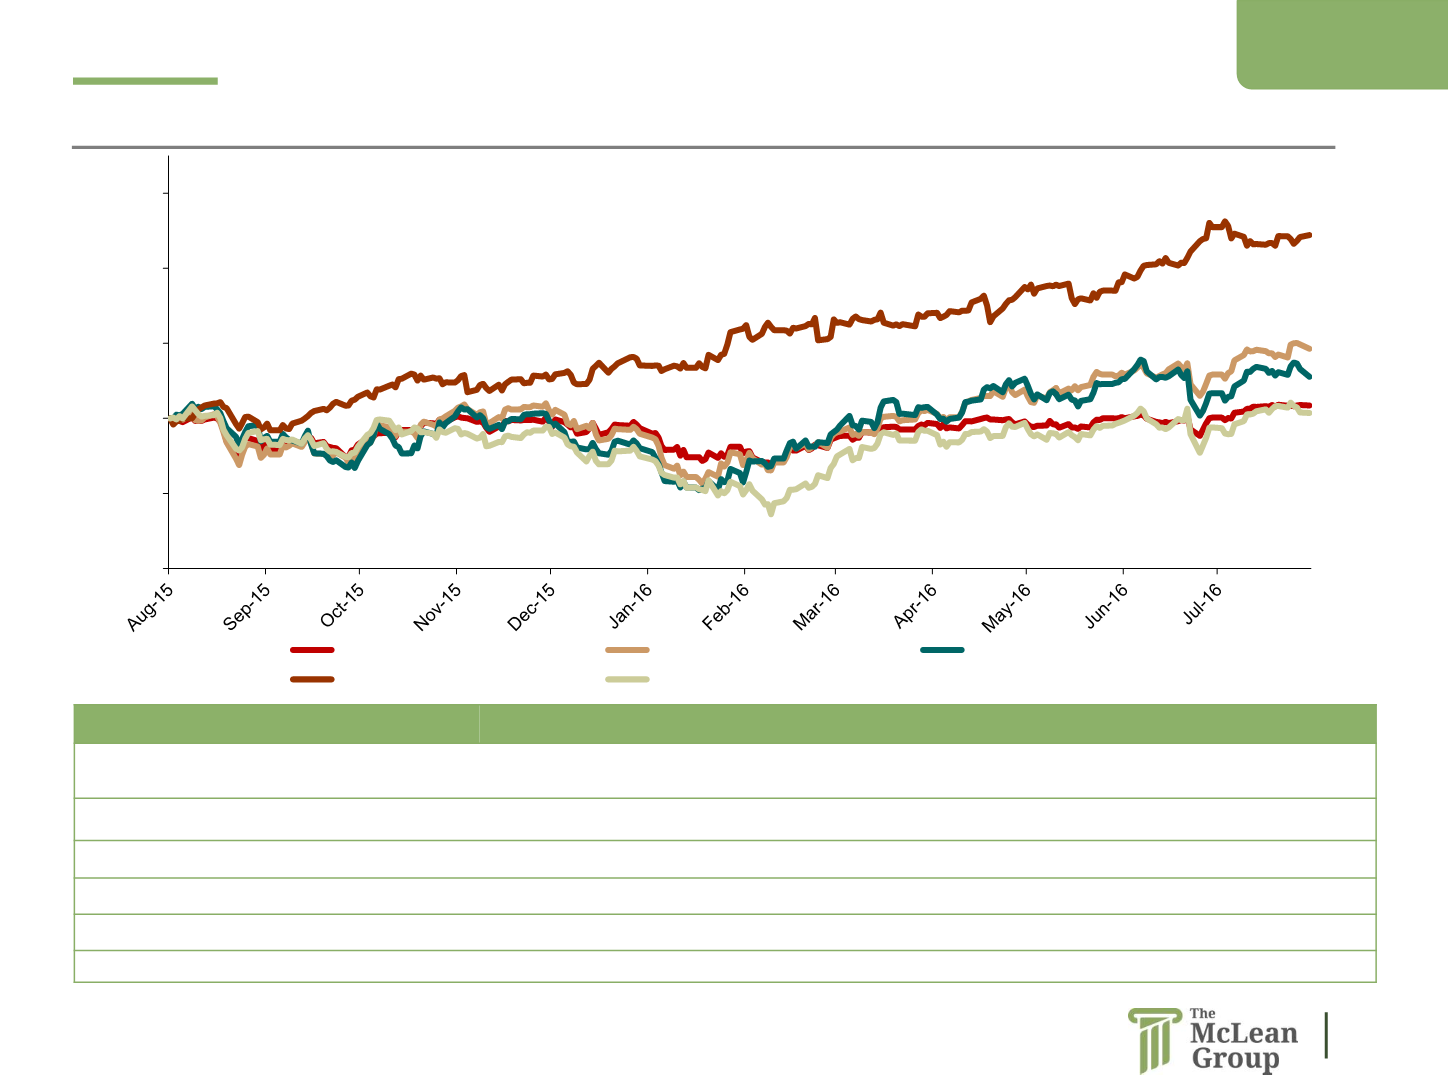
The Market - Custom Index Performance
52 Week Public Market Index Performance
48.9%
18.6%
1.4%
11.1%
3.5%
-40.0%
-20.0%
0.0%
20.0%
40.0%
60.0%
S&P 500
Equipment, Systems, Solutions
Components
Water Services
Environmental Services
% Change
The McLean Group Customer
Indices
1-Year High
1-Year Low
1-Year Median
1-Year Average
Current
Environmental Services
4.2%
-25.6%
-4.6%
-6.4%
1.4%
Equipment, System, Solutions
20.1%
-14.7%
-0.3%
0.2%
18.6%
Water Services
52.5%
-3.2%
21.0%
21.0%
48.9%
Components
15.7%
-19.1%
-0.7%
-0.9%
11.1%
S&P 500
3.7%
-12.8%
-2.3%
-3.2%
3.5%
Source: S&P Capital IQ