6
September 2014
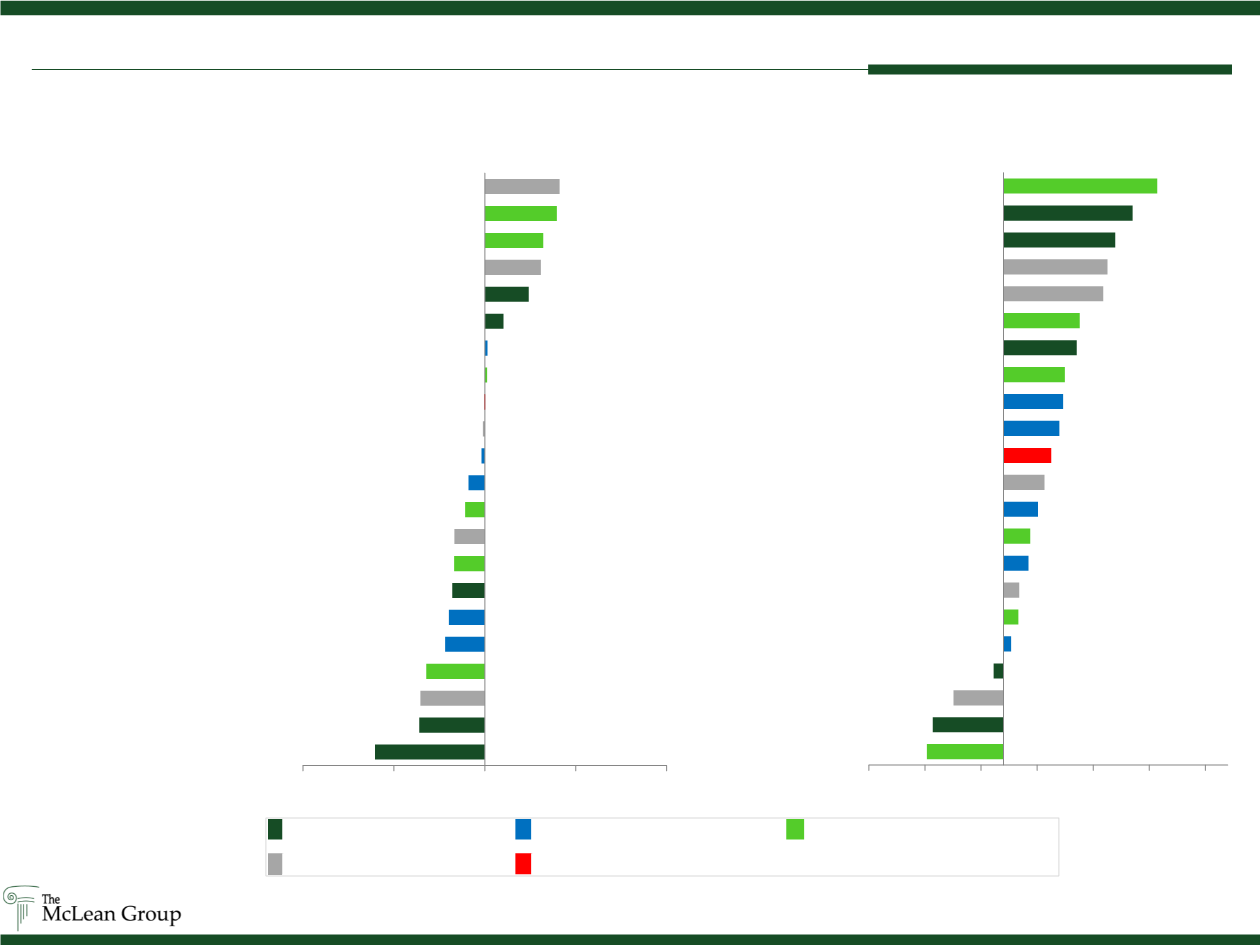
Capital Markets: Stock Performances
Source: Capital IQ as of 8/20/14
(12.1%)
(7.2%)
(7.1%)
(6.5%)
(4.4%)
(4.0%)
(3.6%)
(3.4%)
(3.4%)
(2.2%)
(1.8%)
(0.4%)
(0.2%)
(0.0%)
0.3%
0.3%
2.1%
4.8%
6.2%
6.4%
7.9%
8.2%
(20%)
(10%)
0% 10% 20%
Diamond Offshore
Baker Hughes
Halliburton
SK Innovation Co.
Exxon
BP
Weatherford
Reliance Industries Ltd.
Glencore International
BHP Billiton
Shell
PetroChina
Hornbeck Industries
S&P 500 Index
China Petroleum & Chemical Corp.
Gazprom
Seacor Holdings
Cameron
Maersk
Indian Oil Corporation Ltd.
China Oil & Gas Group
NYK Line
Last Four Weeks
(34.2%)
(31.6%)
(22.2%)
(4.3%)
3.4%
6.7%
7.1%
11.2%
11.9%
15.4%
18.3%
21.3%
25.0%
26.6%
27.3%
32.7%
34.0%
44.5%
46.4%
49.8%
57.6%
68.5%
(60%) (35%) (10%) 15% 40% 65% 90%
SK Innovation Co.
Diamond Offshore
Hornbeck Industries
Seacor Holdings
Gazprom
BHP Billiton
NYK Line
BP
China Oil & Gas Group
Exxon
Glencore International
S&P 500 Index
PetroChina
Shell
Reliance Industries Ltd.
Cameron
China Petroleum & Chemical Corp.
Maersk
Halliburton
Baker Hughes
Weatherford
Indian Oil Corporation Ltd.
Last 52 Weeks
Oil & Gas Services
Inbound Oil & Gas Buyers
International Energy Firms
Oil & Gas Logistics
S&P 500 Index


