


 13 / 21

12
Second Quarter 2016
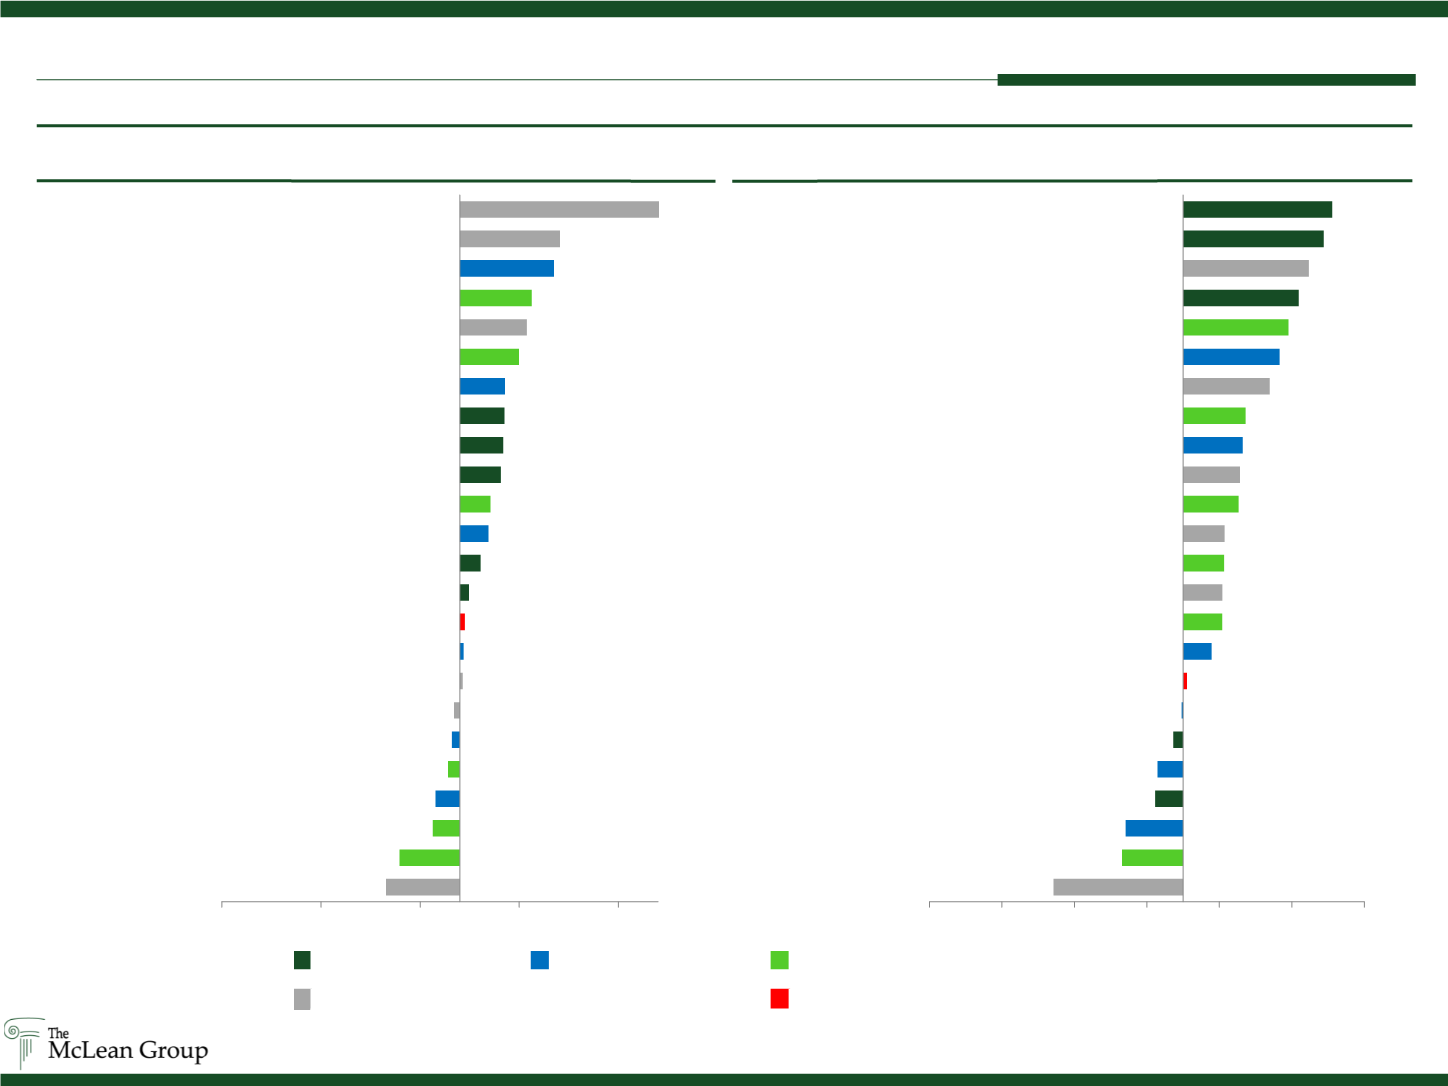
Defense Prime Index
Defense Systems Index Diversified Government Services Index
Middle Market Government Services Index
S&P 500 Index
Capital Markets: Stock Performance
(Defense and Gov. Services)
Source: Public Filings; Capital IQ as of 06/30/16
Second Quarter 2016
Last 52 Week Performance
(18.7%)
(15.2%)
(6.8%)
(6.2%)
(3.0%)
(2.0%)
(1.4%)
0.7%
1.0%
1.3%
2.3%
5.2%
7.2%
7.7%
10.3%
11.0%
11.2%
11.4%
14.9%
16.9%
18.1%
23.7%
25.2%
(60%)
(35%)
(10%)
15% 40%
Kratos
CACI
Leidos
FLIR
Booz
Orbital ATK
VSE
NCI
Cubic
S&P 500
Boeing
General Dynamics
Harris
SAIC
Raytheon
Northrop Grumman
Lockheed Martin
Teledyne
Engility
ICF
ManTech
L-3
Vectrus
KEYW
(35.7%)
(16.9%)
(15.8%)
(7.7%)
(7.0%)
(2.7%)
(0.4%)
1.0%
7.8%
10.8%
10.8%
11.3%
11.4%
15.3%
15.7%
16.4%
17.3%
23.9%
26.6%
29.1%
31.9%
34.7%
38.8%
41.1%
(70%) (50%) (30%) (10%)
10% 30% 50%
Kratos
Engility
Cubic
Boeing
Teledyne
General Dynamics
FLIR
S&P 500
Harris
CACI
KEYW
SAIC
Vectrus
Booz
ICF
Orbital ATK
Leidos
VSE
L-3
ManTech
Lockheed Martin
NCI
Northrop Grumman
Raytheon
54.6%