16
2013 Year in Review
Dry Powder Calculations
(Aerospace)
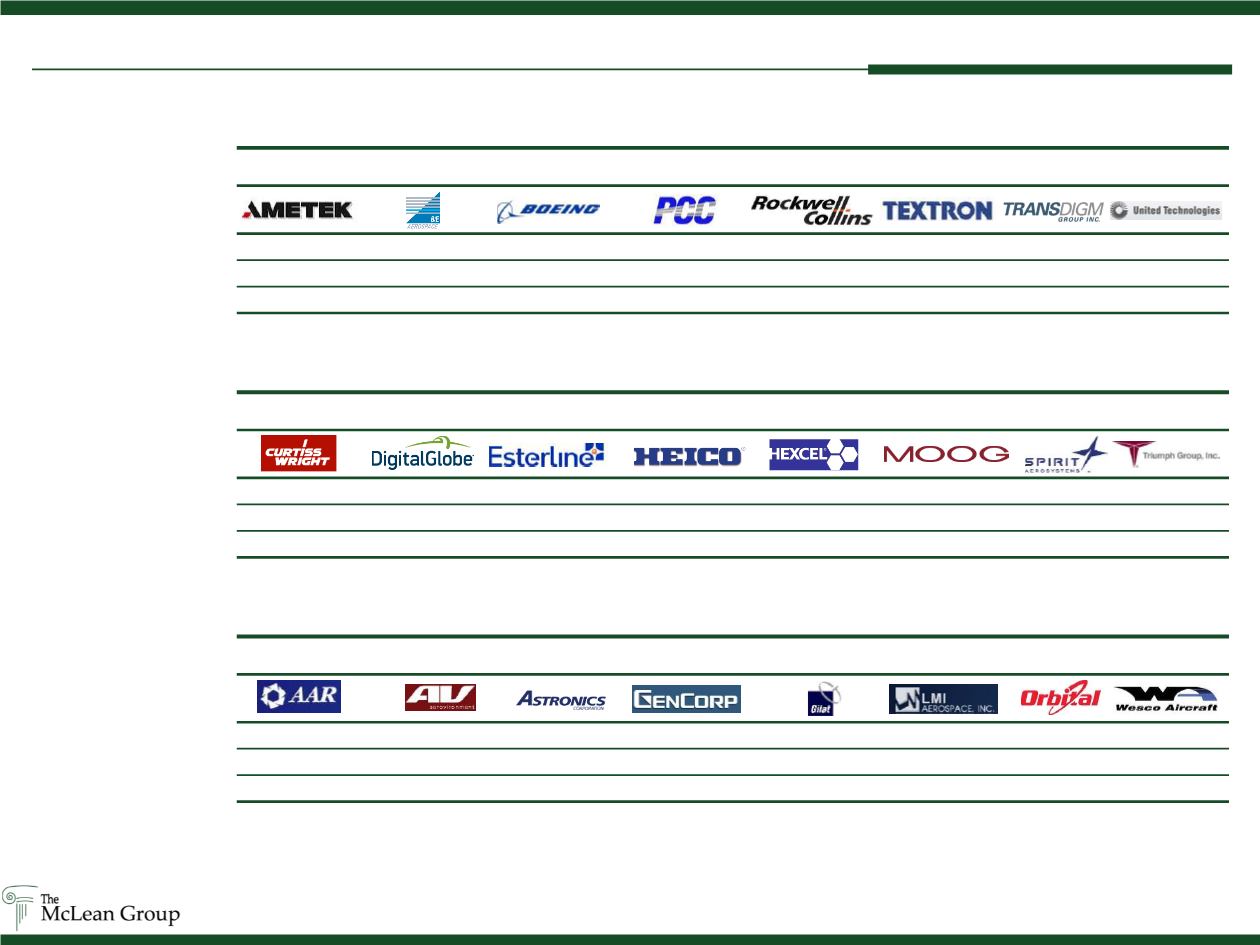
Mid Cap Aerospace Index
3x LTM EBITDA
$1,024.7
$723.3
$1,053.7
$661.1
$990.6
$1,109.4
$741.6
$1,707.4
Less LT Debt
959.7
1,143.9
689.1
377.5
295.0
699.0
1,171.5
1,621.5
Plus Cash
171.4
256.0
179.2
15.5
65.5
179.6
435.6
25.4
Dry Powder
$236.3
($164.6)
$543.8
$299.1
$761.1
$589.9
$5.7
$111.3
Small Cap Aerospace Index
3x LTM EBITDA
$565.2
-$2.1
$149.5
$232.8
$62.4
$144.3
$470.4
$576.5
Less LT Debt
680.8
0.0
198.8
705.1
39.4
296.3
145.1
570.6
Plus Cash
98.5
66.1
68.2
181.9
53.9
1.6
241.3
78.7
Dry Powder
($17.1)
$64.1
$18.9
($290.4)
$76.9
($150.4)
$566.6
$84.7
Large Cap Aerospace Index
3x LTM EBITDA
$2,793.0
$2,156.7
$24,516.0
$8,615.7
$3,117.0
$3,504.0
$2,664.3
$33,090.0
Less LT Debt
1,415.1
2,207.9
9,635.0
3,557.0
2,575.0
1,931.0
5,745.7
20,241.0
Plus Cash
295.2
637.8
9,088.0
0.0
439.0
1,163.0
0.0
4,619.0
Dry Powder
$1,673.1
$586.6
$23,969.0
$5,058.7
$981.0
$2,736.0 ($3,081.4)
$17,468.0
($ millions)
Source: Public Filings; Capital IQ as of 02/03/14


