12
2013 Year in Review
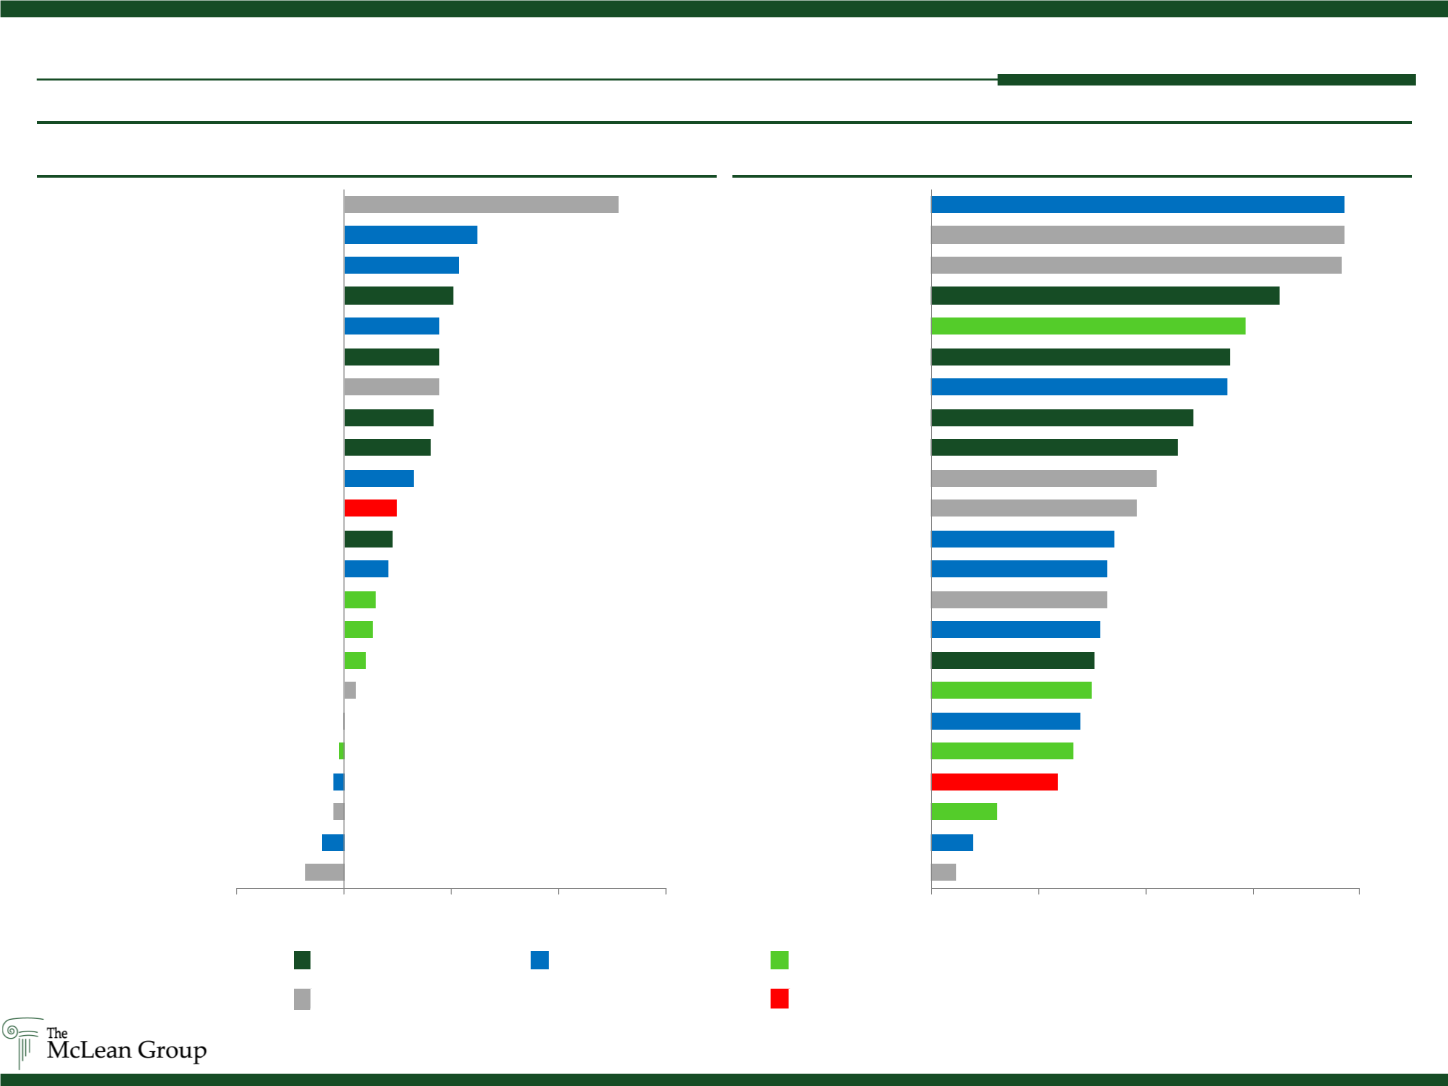
(7.2%)
(4.1%)
(2.0%)
(1.9%)
(0.9%)
(0.1%)
2.3%
4.1%
5.3%
5.9%
8.2%
9.2%
9.9%
13.1%
16.2%
16.6%
17.6%
17.7%
17.7%
20.3%
21.3%
24.7%
51.1%
(20%)
0% 20% 40% 60%
Kratos
Flir
ICF
Cubic
Booz
KEYW
VSE
ManTech
Engility
CACI
Teledyne
General Dynamics
S&P 500
L-3
Boeing
Lockheed Martin
NCI
Raytheon
Harris
Northrop Grumman
Exelis
Alliant Techsystems
Dynamics Research
Fourth Quarter 2013
5.9%
9.8%
15.4%
29.6%
33.1%
34.9%
37.6%
37.9%
39.5%
41.2%
41.2%
42.6%
48.1%
52.7%
57.6%
61.1%
69.1%
69.6%
73.4%
81.1%
95.9%
96.2%
96.4%
0% 25% 50% 75% 100%
KEYW
Cubic
ManTech
S&P 500
CACI
Flir
Booz
General Dynamics
L-3
NCI
Teledyne
Harris
ICF
Kratos
Raytheon
Lockheed Martin
Exelis
Northrop Grumman
Engility
Boeing
VSE
Dynamics Research
Alliant Techsystems
CY2013
Capital Markets: Stock Performance
(Defense and Gov. Services)
Defense Prime Index
Defense Systems Index Diversified Government Services Index
Middle Market Government Services Index
S&P 500 Index
Source: Public Filings; Capital IQ as of 12/31/13


