


 11 / 20

11
As of 08/09/2016
11
Q2
2016
M&A Summary Transaction Analysis
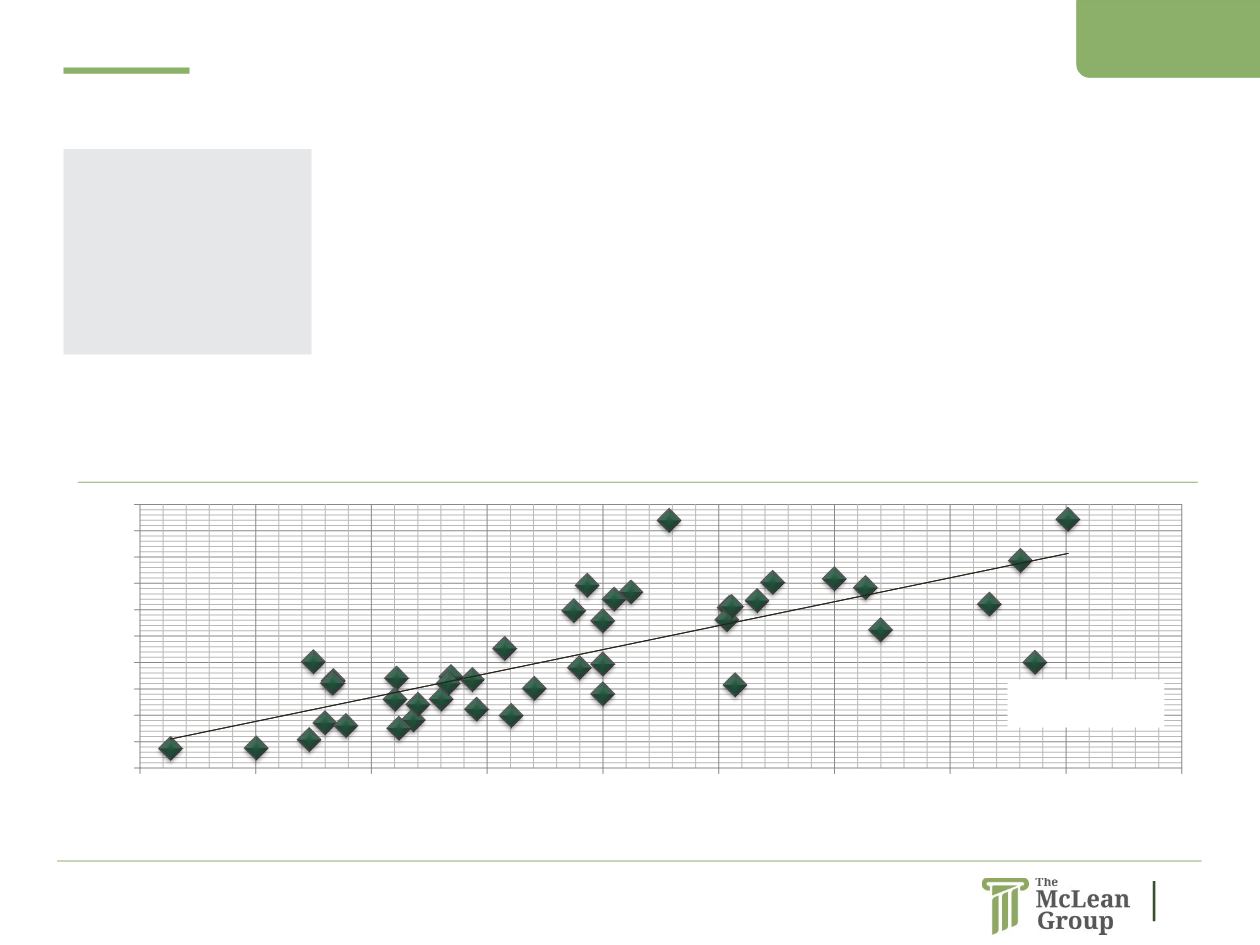
y = 9.0806x + 0.4304
R² = 0.5938
0.0
0.5
1.0
1.5
2.0
2.5
3.0
3.5
4.0
4.5
5.0
0.0%
5.0%
10.0%
15.0%
20.0%
25.0%
30.0%
35.0%
40.0%
45.0%
LTM Revenue Multiple
LTM EBITDA Margin
Transactional Value Matrix – Revenue Multiple to EBITDA Margin
Select Reported Transactions from 2002 to present
Transaction valuations are relatively consistent, with annual medians ranging from 9 to 12x
LTM EBITDA.
Regression line shows “average” relationship between revenue multiple and EBITDA margin.
Fairly consistent correlation between transaction valuation and LTM EBITDA margin.
For example, a target with $50 million in revenue and a 20% EBITDA margin on average would
be valued at 2.2 x revenue or $110 million.
Summary